Queue Analytics
Detect, measure and resolve queues before you lose the sale
KSI detects how many people are waiting, how many are being served, and how many service points are active. It computes service saturation in real time and triggers alerts when the SLA you defined is breached.
Every unattended queue is a lost sale
In retail, supermarkets, and airports, the queue is the moment of maximum friction. It's where the cart gets abandoned, where the passenger complains, where NPS drops. And it's almost always discovered late - after the fact.
Traditional queue monitoring either uses dedicated sensors (expensive, fixed, doesn't scale) or measures aggregated average time (no SLA context, no actionable alert). KSI does the opposite: real-time, on the cameras you already have, with thresholds you define.
What isn't measured in real time can't be acted on
From detection to actionable alert
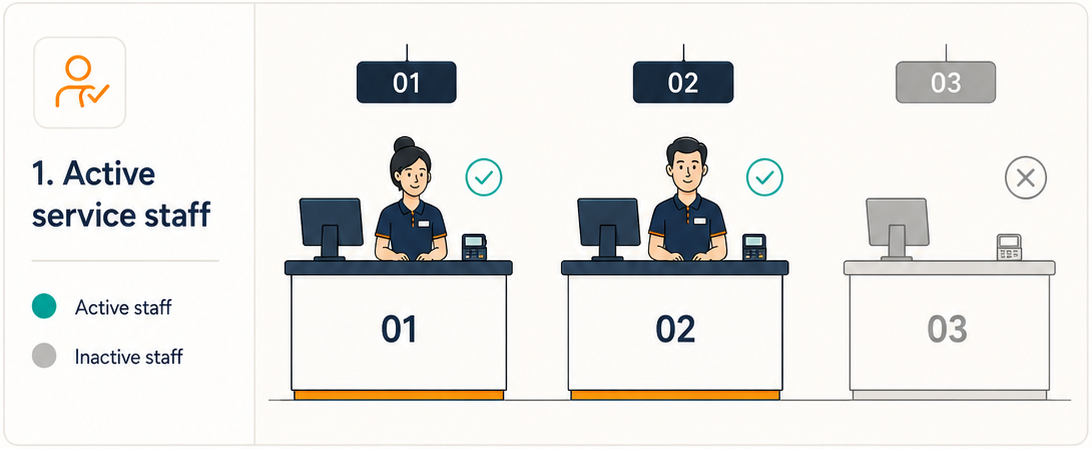
1. Active service staff
KSI detects how many service points are actually operating (not just how many physically exist).
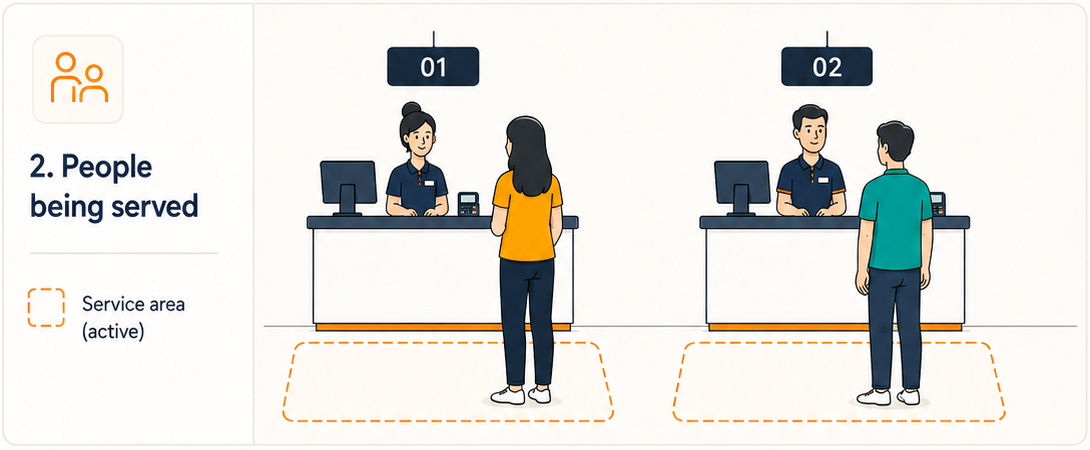
2. People being served
Counts how many customers are being served right now, per service point.
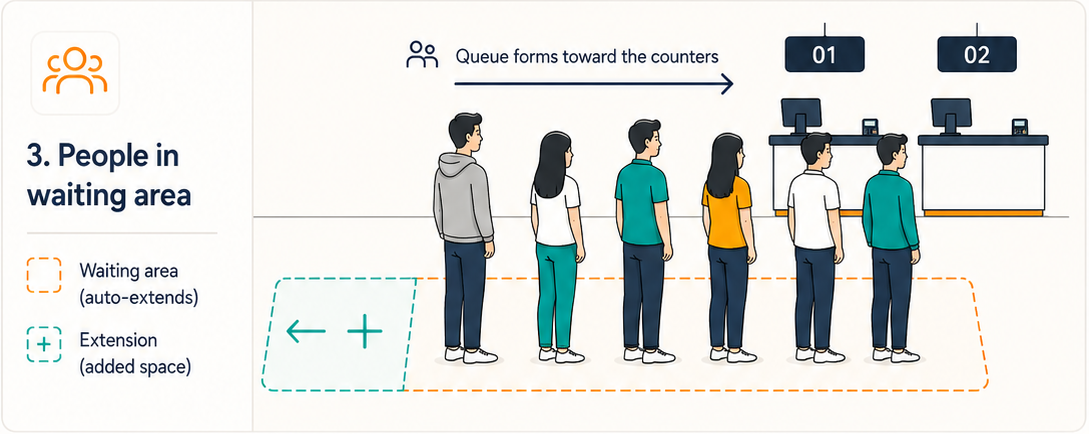
3. People in waiting area
Detects how many are waiting. If the queue overflows, automatically extends the zone or activates additional cameras.
4. Saturation (SAT) and alert
SAT = people waiting / (active service points × acceptable ratio). If it goes above 100%, fires an operational alert to the channel of your choice.
Built for real-world queues, not drawn zones
Multiple cameras, one single queue
When a queue is so long that no single camera sees it end to end, KSI stitches the views of several cameras into one single queue. People, wait times and saturation are computed over the whole queue, no matter how many cameras it spans.
Dynamic queues, built live
Not every queue forms where it should. When the line overflows its usual spot or builds up in a space with no defined path, KSI constructs the queue live and dynamically: it detects its real shape at every moment and measures all of it, without relying on fixed zones that fall short.
More traffic does not always mean more sales
Beyond a certain threshold, more visitors can reduce your conversion: crowded aisles, long lines and customers who leave without buying. It is a pattern visible in real store data, and it usually goes unnoticed because traditional metrics only count people at the door.
Queues are the first visible symptom. Purchase abandonment accelerates past 5 to 7 minutes of waiting: detecting queues in real time is the difference between recovering the sale and finding out in Monday's report.
Real-time operations, not end-of-month reports
Checkout saturation alerts
Notify the store manager when the queue exceeds the acceptable threshold, before sales are lost.
Staff sizing
Historical saturation data by hour and day to plan shifts based on real demand.
SLA compliance
Objective compliance reports for the service standard your brand promised the customer.
Airport queues
Check-in, security, immigration, boarding - centralized operational visibility.
More than 99% accuracy, every shift
Real time, not history
Alerts arrive while you can still act. Not the next day, when the customer is gone.
No additional sensors
Works with your existing security cameras. No construction, no new wiring.